Drink Consumption
knitr::opts_chunk$set(
  message = FALSE,
  warning = FALSE,
  tidy=FALSE,
  size="small")
options(digits = 3)

knitr::opts_chunk$set(
  fig.width=6.75,
  fig.height=6.75,
  fig.align = "center"
)
library(tidyverse)
library(mosaic)
library(ggthemes)
library(lubridate)
library(fivethirtyeight)
library(here)
library(skimr)
library(janitor)
library(vroom)
library(tidyquant)
library(rvest)Where Do People Drink The Most Beer, Wine And Spirits?
Back in 2014,
fivethiryeight.com
published an article on alchohol consumption in different countries. The
data drinks is available as part of the fivethirtyeight package.
Make sure you have installed the fivethirtyeight package before
proceeding.
library(fivethirtyeight)
data(drinks)
What are the variable types? Any missing values we should worry about?
There is 1 character variable and 4 numeric variables. No missing values to worry about.
drinks %>% skim #Skim the data for variable types and missing values.| Name | Piped data |
| Number of rows | 193 |
| Number of columns | 5 |
| _______________________ | |
| Column type frequency: | |
| character | 1 |
| numeric | 4 |
| ________________________ | |
| Group variables | None |
Variable type: character
| skim_variable | n_missing | complete_rate | min | max | empty | n_unique | whitespace |
|---|---|---|---|---|---|---|---|
| country | 0 | 1 | 3 | 28 | 0 | 193 | 0 |
Variable type: numeric
| skim_variable | n_missing | complete_rate | mean | sd | p0 | p25 | p50 | p75 | p100 | hist |
|---|---|---|---|---|---|---|---|---|---|---|
| beer_servings | 0 | 1 | 106.16 | 101.14 | 0 | 20.0 | 76.0 | 188.0 | 376.0 | ▇▃▂▂▁ |
| spirit_servings | 0 | 1 | 80.99 | 88.28 | 0 | 4.0 | 56.0 | 128.0 | 438.0 | ▇▃▂▁▁ |
| wine_servings | 0 | 1 | 49.45 | 79.70 | 0 | 1.0 | 8.0 | 59.0 | 370.0 | ▇▁▁▁▁ |
| total_litres_of_pure_alcohol | 0 | 1 | 4.72 | 3.77 | 0 | 1.3 | 4.2 | 7.2 | 14.4 | ▇▃▅▃▁ |
There is 1 character variable and 4 numeric variables. No missing values to worry about.
Make a plot that shows the top 25 beer consuming countries
#Create a plot to show the top 25 beer consuming countries
drinks %>%
  slice_max(order_by=beer_servings, n=25) %>%  #Select the top 25 beer consuming countries data
  ggplot(aes(x=beer_servings, y=reorder(country,beer_servings))) + # Plot the data, descending order
  geom_col() +
  theme_bw() +
  labs(title='Beer Consumption by Country', subtitle= 'Top 25', x='Servings (per person)', y='Country') +
  NULL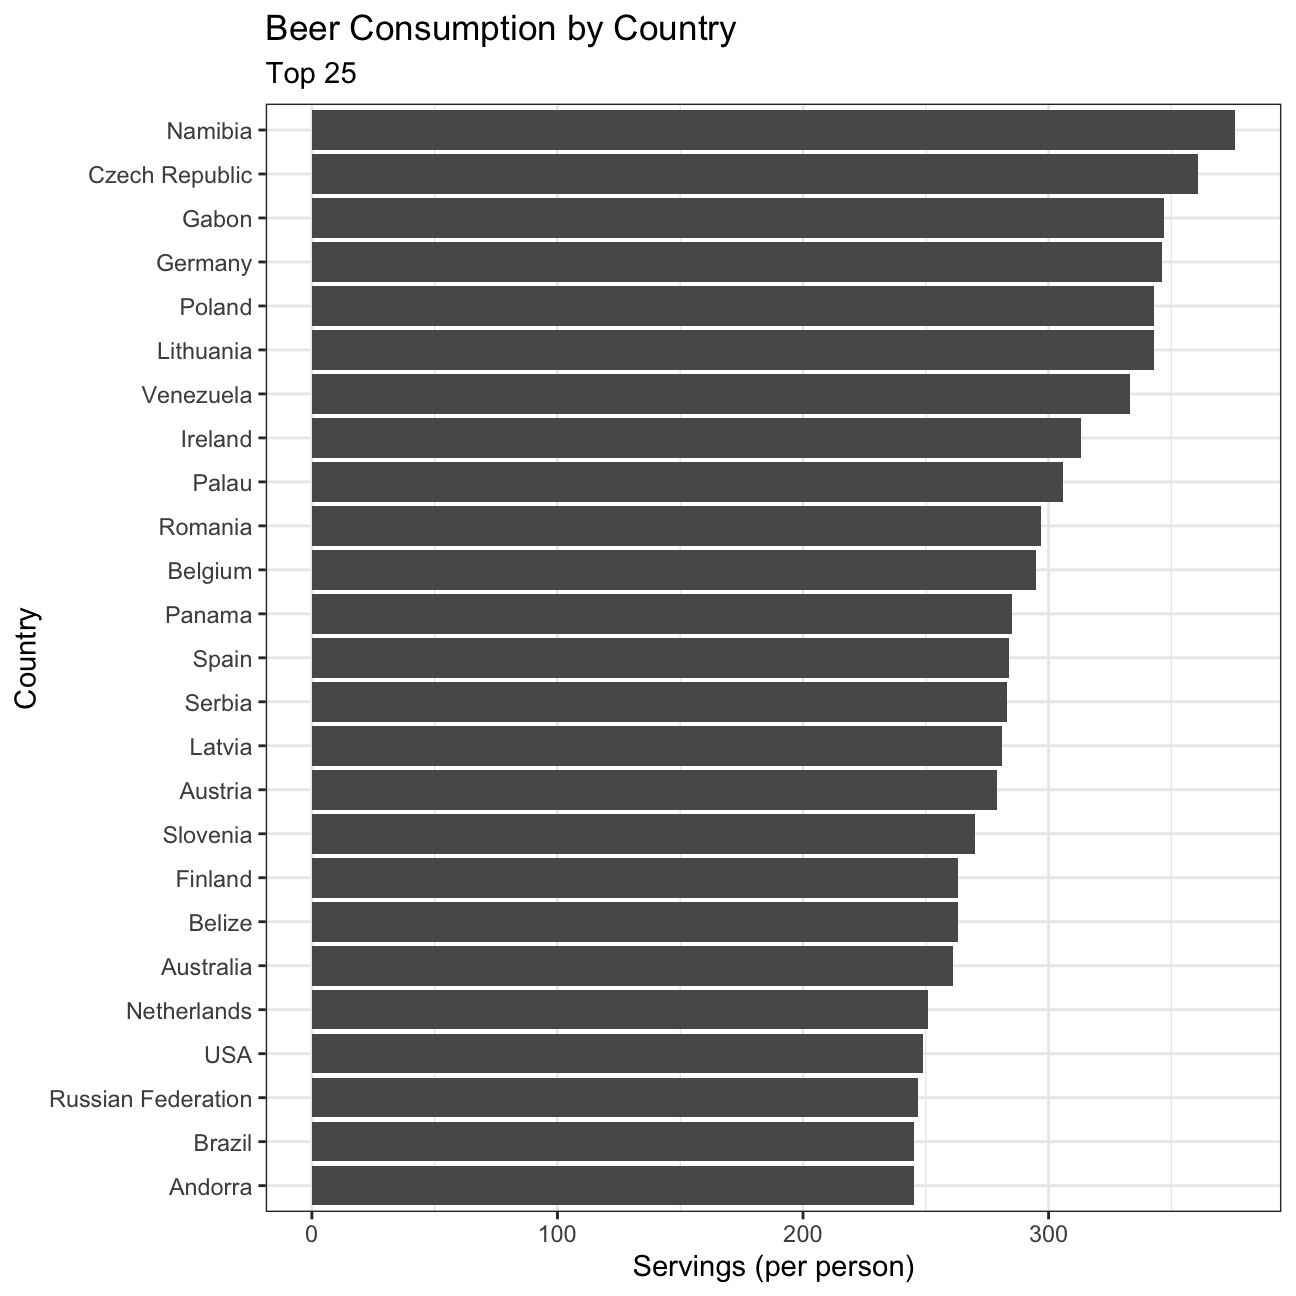
Make a plot that shows the top 25 wine consuming countries
#Create a plot to show the top 25 wine consuming countries
drinks %>%
  slice_max(order_by=wine_servings, n=25) %>% #Select the top 25 wine consuming countries
  ggplot(aes(x=wine_servings, y=reorder(country, wine_servings)))+ # Plot the data, descending order
  geom_col() +
  theme_bw() +
  labs(title='Wine Consumption by Country',subtitle= 'Top 25', x='Servings (per person)', y='Country') +
  NULL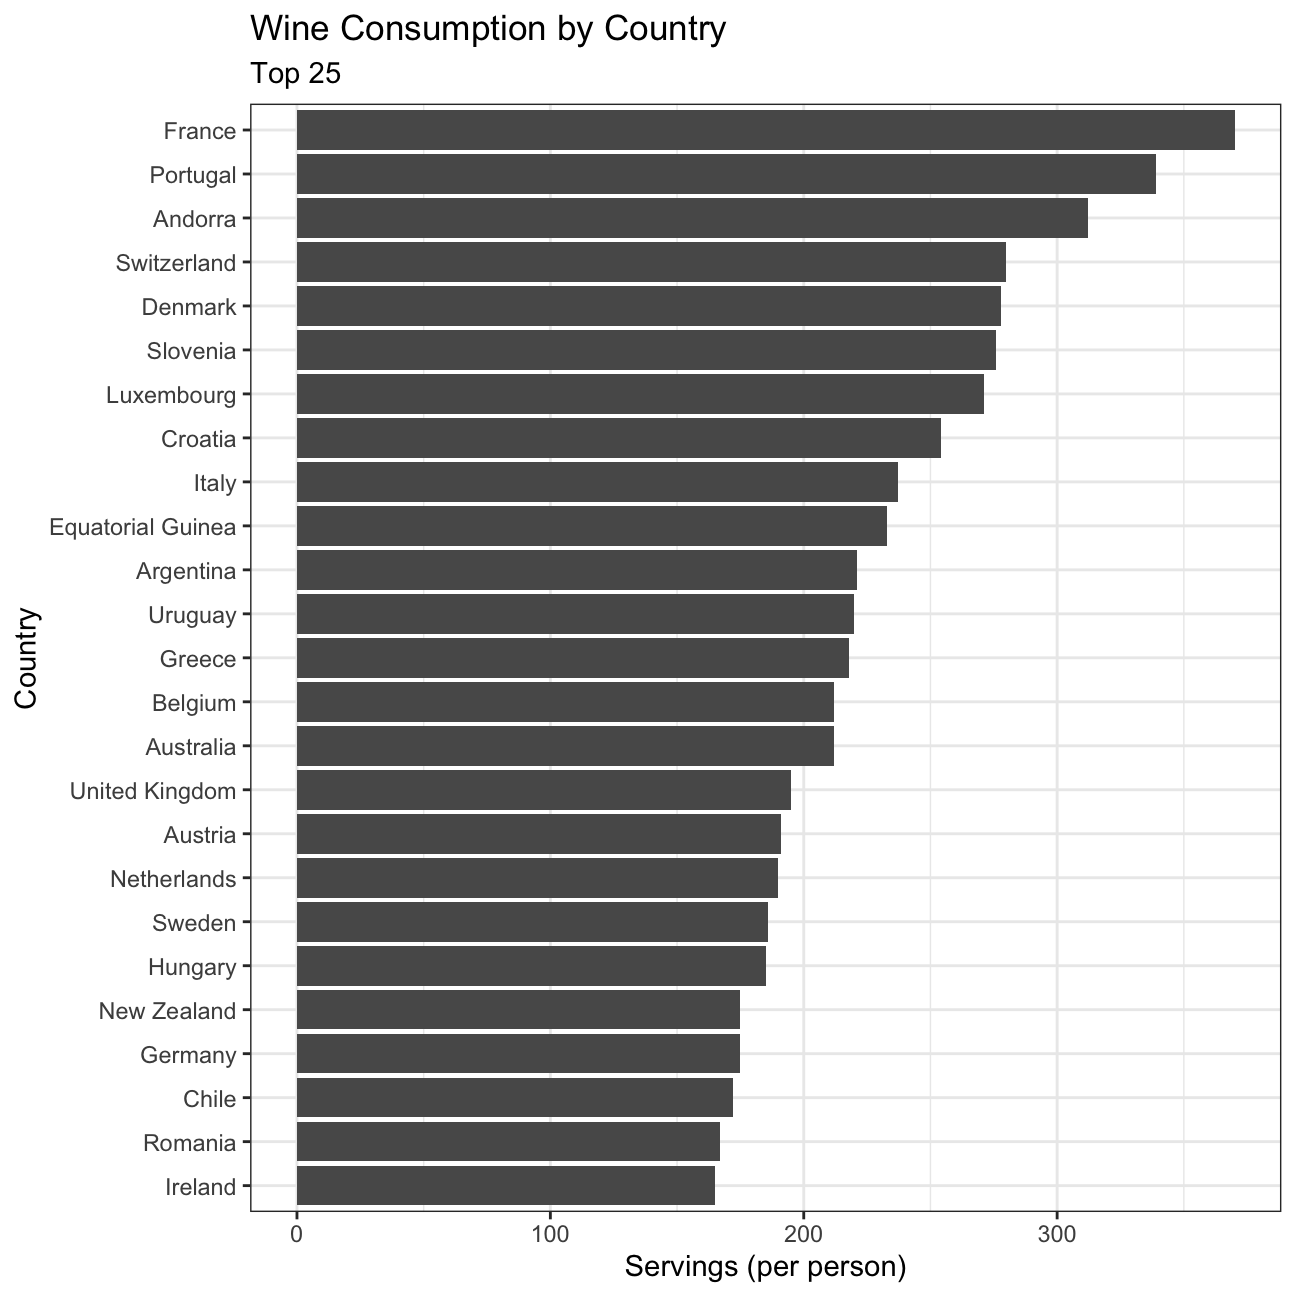
Finally, make a plot that shows the top 25 spirit consuming countries
#Create a plot to show the top 25 spirit consuming countries
drinks %>%
  slice_max(order_by=spirit_servings, n=25) %>% #Select the top 25 spirit consuming countries
  ggplot(aes(x=spirit_servings, y=reorder(country,spirit_servings))) + # Plot the data, descending order
  geom_col() +
  theme_bw() +
  labs(title='Spirit Consumption by Country', subtitle= 'Top 25', x='Servings (per person)', y='Country') +
  NULL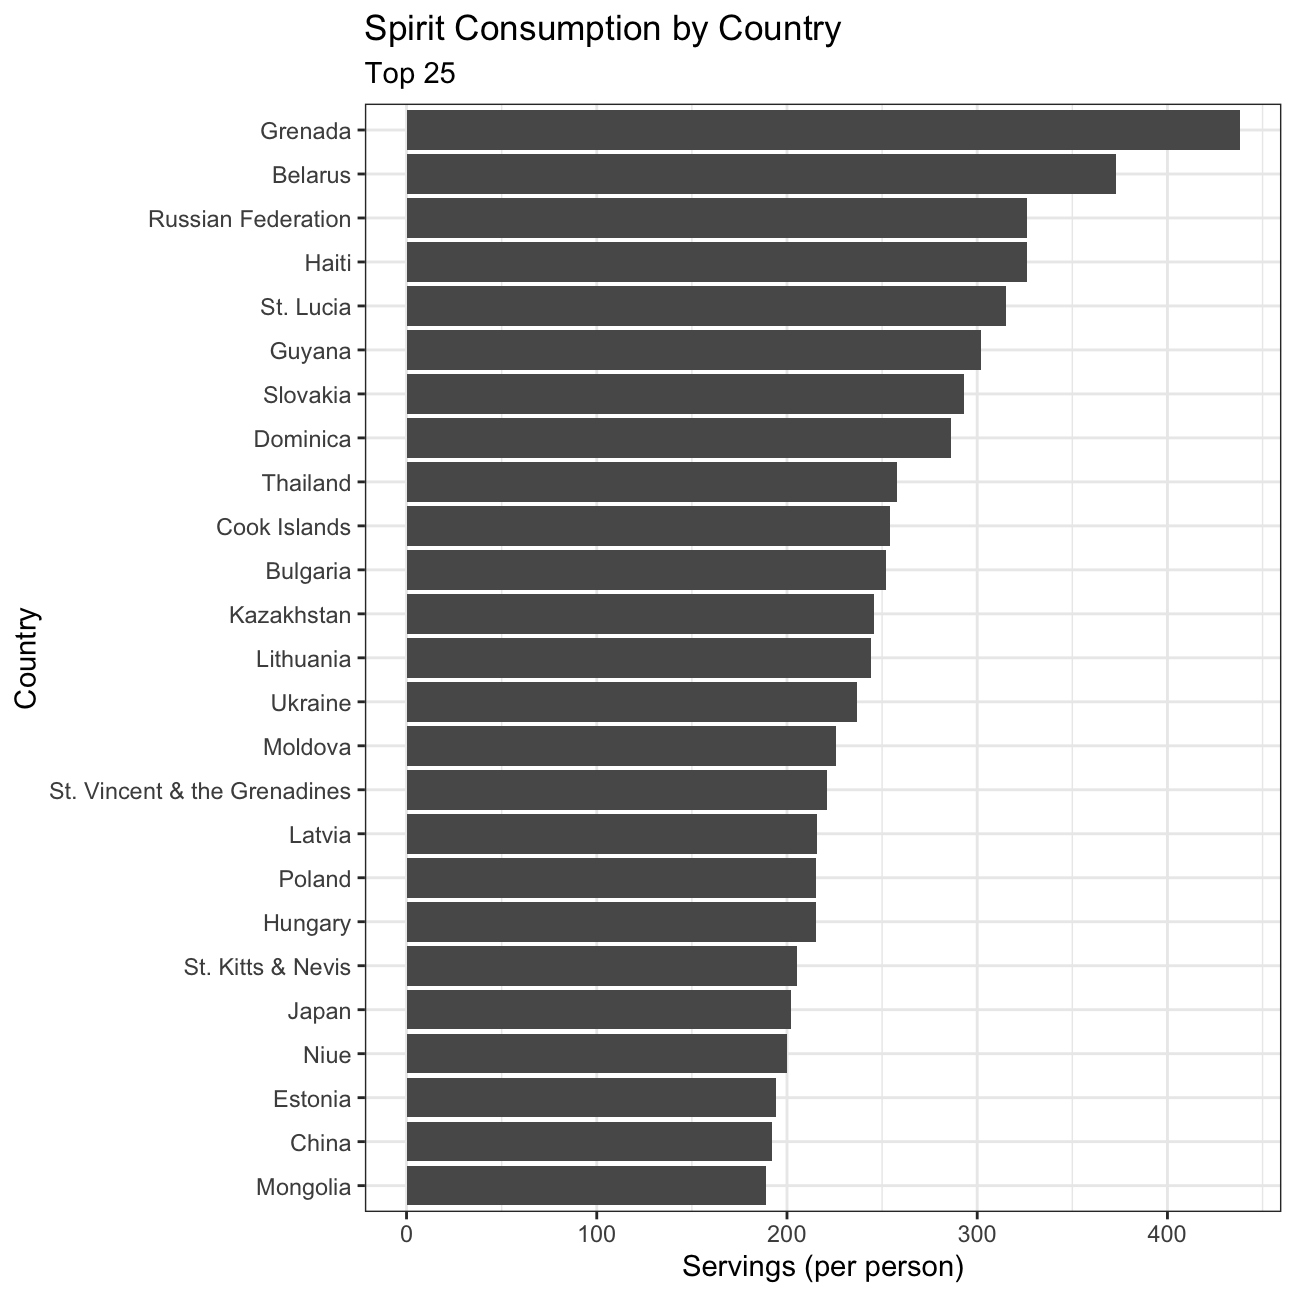
What can you infer from these plots? Don’t just explain what’s in the graph, but speculate or tell a short story (1-2 paragraphs max).
TYPE YOUR ANSWER AFTER (AND OUTSIDE!) THIS BLOCKQUOTE.
Rudimental factors that affect consumption of beer, wine, and spirit include production levels, drinking age limit, pricing, and culture.
Based on the data, it can be observed that beer consumption is the highest for Namibia, Czech Republic, Gabon, and Germany. This can perhaps be attributed to the beer triangle in Namibia, low-cost beer in Czech Republic (cheaper than water), and the lowest drinking age in Germany (16 as opposed to 18 for other countries) (Kohli 2021, Nugent 2021) .
As for wine consumption, France (370 wine servings), Portugal, Andorra, and Switzerland top the list while Ireland is in position 25, at 150 servings. The distribution of the 25 countries seems to have high variance.
Lastly, similar to the wine consumption distribution, spirit consumption also appears to have high variance. While Grenada has a high consumption of spirits perhaps due to culture (women have higher per capita consumption than men) and Belarus due to the relaxed policies, Mongolia may have lower consumption as they prefer their regional fermented milk alcohol drinks (OECD 2020).